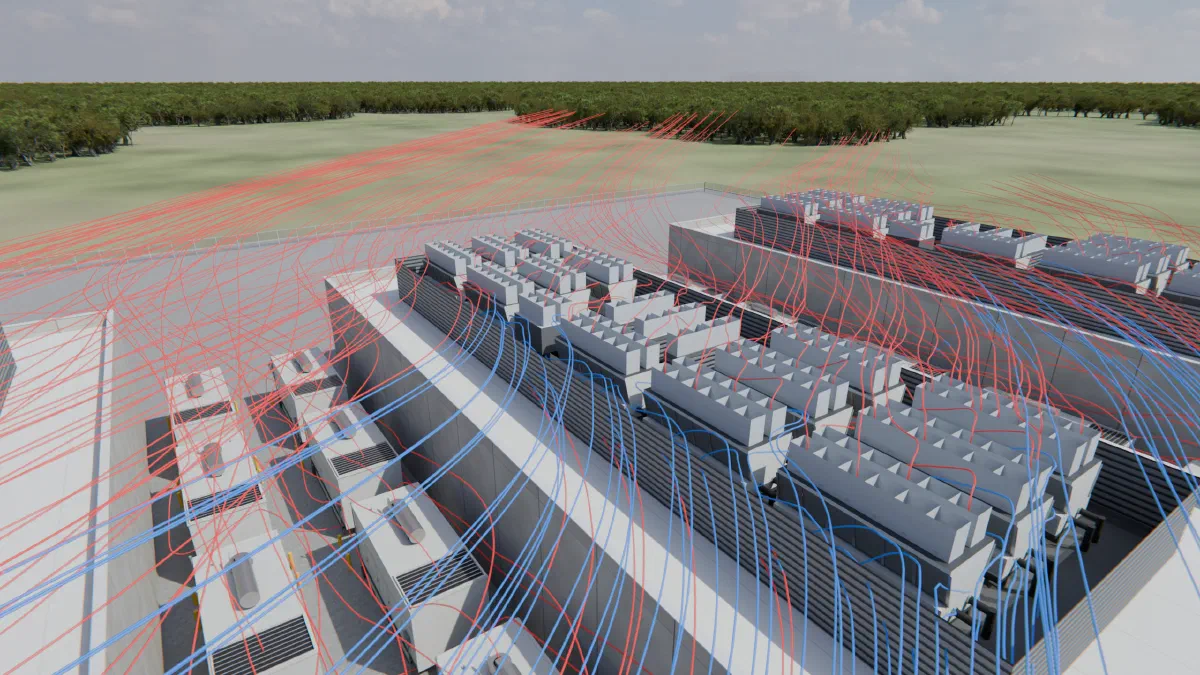
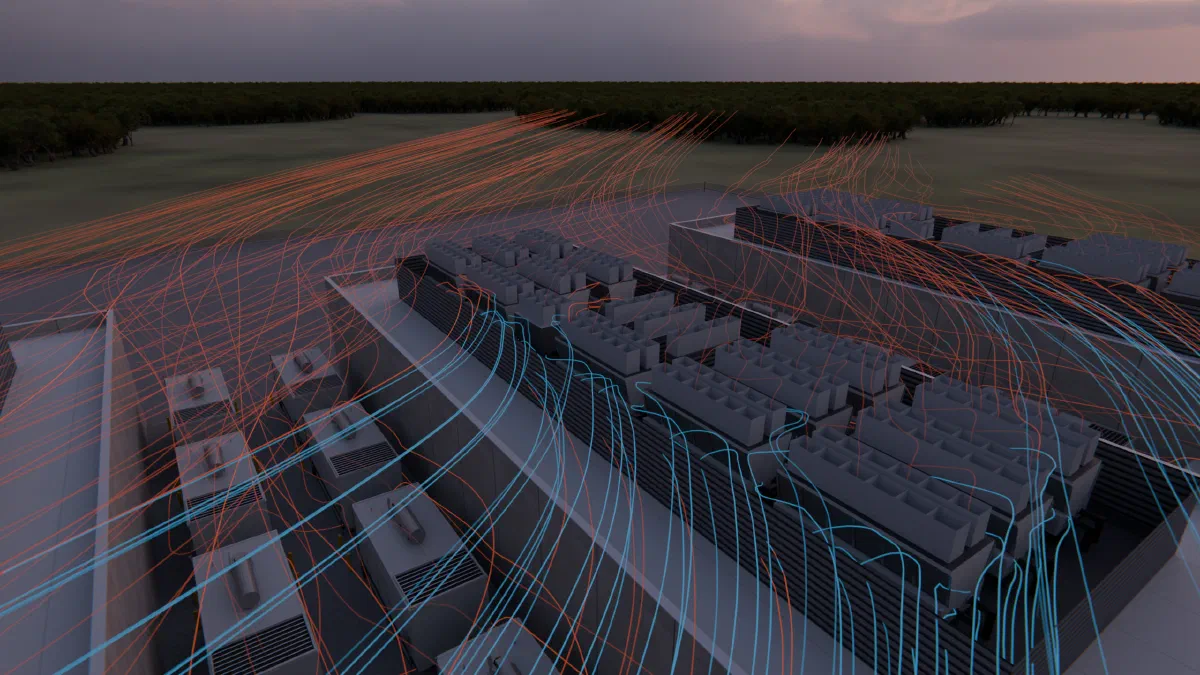
An air-cooled chiller is rated for clean outside air. In a real yard, some of the air arriving at its coil is air that a chiller already warmed, either its own or a neighbor’s. The size of that effect depends on wind direction, on what stands near the row, and on things added for other reasons, such as a noise screen. It does not show on a layout drawing.
Why a few degrees matter
An air-cooled chiller rejects heat to the air passing through its condenser coil. If that air arrives warmer than planned, the refrigerant must run at a higher pressure to reject the same heat. Trane’s catalog for its Sintesis air-cooled chillers says it directly: both warm air recirculation and coil starvation “cause reductions in unit efficiency and capacity due to higher head pressures” (Trane RLC-PRC049K-EN). The same catalog gives the unit’s operating range as 14 to 115 °F (-10 to 46 °C) ambient, up to 130 °F (54 °C) with the high-ambient option, and asks for roughly double the single-unit clearance when units sit close together. It also asks that the tops of any surrounding walls be no higher than the fan tops.
Rating happens at one point. Air-cooled chillers are rated at 95 °F (35 °C) entering air under AHRI Standard 550/590. A coil that sees 101 °F air on a 95 °F day is running above its rating condition on the day the plant is sized for.
A yard we built to test it
To see how large the effect can be, we built a synthetic yard, not a customer site. It has a 30 m by 15 m single-story building and five air-cooled condensers of 80 kW each in a row along its north wall, 5.5 m from the wall, at 5 m centers. Each unit is 3 m by 2 m and 2.5 m (8 ft) tall. Each draws 10 m³/s through its sides and discharges straight up. The design day is 95 °F (35 °C) with a 4 m/s (9 mph) wind at the standard 10 m height.
We solved it three times and changed one thing at a time:
- Wind along the row. Each plume is carried toward the next unit.
- Wind across the row, toward the building. The building stands just downwind.
- The same cross wind, with a 5 m (16 ft) acoustic screen 10 m upwind of the row, with returns at each end. Nothing else changed.
The table is the rise of each chiller’s intake air over the 95 °F ambient, averaged across the intake face.
| Chiller | Along the row | Across the row | Across, with screen |
|---|---|---|---|
| 1 | 0.1 °F | 0.2 °F | 1.4 °F |
| 2 | 0.4 °F | 0.2 °F | 4.0 °F |
| 3 | 0.7 °F | 0.2 °F | 6.3 °F |
| 4 | 0.9 °F | 0.2 °F | 4.0 °F |
| 5 | 1.0 °F | 0.2 °F | 1.4 °F |
| Row average | 0.6 °F | 0.2 °F | 3.4 °F |
What the numbers say
With the wind along the row, the effect builds from unit to unit, from 0.1 °F at the first chiller to 1.0 °F at the fifth. Each plume lands on the next unit downwind.
With the wind across the row toward the building, nearly all of it disappears. Every unit sees 0.2 °F. The wind carries each plume off the row, and the building 5.5 m behind it did not hold the exhaust back.
With the screen, the worst chiller sees 6.3 °F over ambient, about 29 times the unscreened case. The middle unit is breathing 101.3 °F (38.5 °C) air on a 95 °F day, and about a third of the air reaching its coil (34.7 percent) is the row’s own exhaust. The two units beside it are 4.0 °F above ambient.
The reason is the eddy behind the wall. Without the screen, air at intake height moves toward the building at about 1.2 m/s. Behind the screen it runs the other way, back toward the wall, at about 0.9 m/s, and just above the units it nearly stops. The row sits inside that eddy, so its exhaust circles the yard instead of leaving it.
The worst layout here is not the one with the wind blowing toward the building. It is the same layout after a wall was added for noise.
How settled these are
Our platform stops a run when its answer stops moving. We reran all three cases from the start to 3,000 iterations with that stop switched off. No chiller’s intake moved more than 0.01 °F between the stop and 3,000 iterations, and none moved at all over the last 300. The ranking of the three layouts was the same at every checkpoint.
These runs use the k-epsilon turbulence model, a steady buoyancy approximation, and first-order upwind differencing. A single intake’s temperature is a study result with some spread, not a measurement. The ordering and the size of the gap, 0.2 °F against 6.3 °F, is not close to that spread.
What this does and does not show
It does not say that a screen is always a bad idea, or that a yard can be rescued by choosing wind. Orientation and layout are usually fixed long before anyone runs a study. It shows that a choice made for one reason can change the thermal result, and that the change is visible in a solve and not on a drawing.
It is one synthetic yard at one wind speed. It is also not a comparison with field measurements. The yard has no generators, so it says nothing about generator exhaust.
Some questions to ask before trusting a yard layout:
- What wind directions were run, and was the worst one among them?
- What stands upwind of the row: a wall, a screen, a neighboring building?
- What is the intake temperature at each unit, not the row average?
- How does that temperature compare with the temperature each unit is rated at?
If you have a chiller yard and want these answered for it, our engineers run the studies described on the campus airflow studies page.