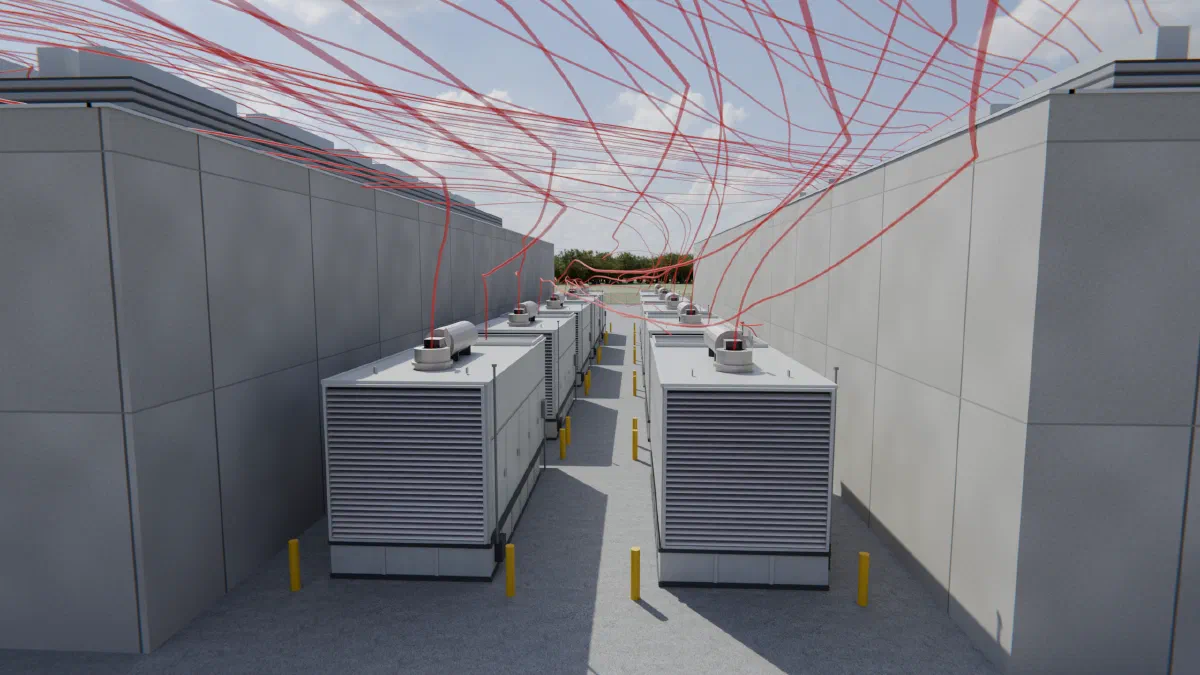
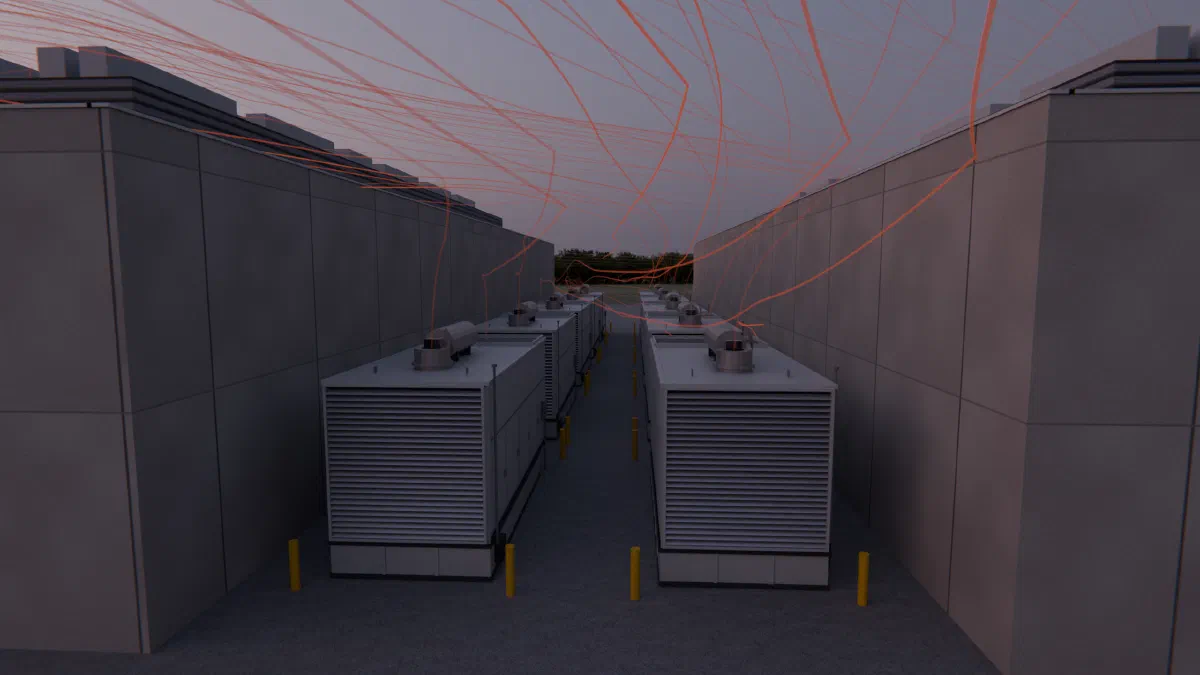
A quick noise estimate can tell you whether a layout is obviously in trouble. It cannot tell you whether you will pass a permit. That takes a method written into the ordinance, manufacturer data for every unit, and an engineer who will put a name on the result. This article does the arithmetic of the quick estimate, shows where it breaks, and lists what the full study adds.
Sound power and sound pressure
A fan or a chiller has one sound power, in watts, no matter where you stand. Engineers state it as a level, dB. Sound pressure is what a person or a microphone at the property line receives, and it depends on distance, ground, walls and weather. Equipment data sheets give sound power. Ordinances limit sound pressure. Everything below is the work of getting from one to the other.
Spreading with distance
Sound from a small source spreads over a growing surface. Over open hard ground the source radiates into a half sphere, and the level at distance meters is:
Doubling the distance adds a factor of 4 in area, which is dB less. Take a generator rated 100 dB(A) sound power. At 25 m it reads 64 dB(A) before any other loss, at 50 m it reads 58 dB(A), and at 100 m it reads 52 dB(A). Air absorbs a little more as the distance grows, about 2.8 dB per kilometer for the 500 Hz band at 68 °F (20 °C) and 70 percent humidity (the coefficient comes from ISO 9613-1). At 100 m that is under 0.3 dB, so distance matters far more than absorption in a yard.
Adding sources
Sound adds as energy, not as decibels. Two equal sources are dB louder than one. Ten equal sources are dB louder. A louder source also dominates: 70, 70 and 60 dB add to dB, so the 60 dB unit adds only 0.2 dB over the other two.
That has a consequence for a yard. Ten chillers at the same spot are 10 dB louder than one, not ten times as many decibels. A layout that passes with one unit at a given distance reads 10 dB higher with ten units there, as the chart below shows.
A-weighting
People hear mid frequencies better than low ones, so limits are usually written in dB(A), which discounts each octave band by a fixed amount before summing. The A-weighting curve is standardized in IEC 61672. It also hides a problem. A fan with a strong low-frequency hum can meet a dB(A) limit and still annoy a neighbor, which is why some ordinances add a separate low-frequency or tonal test. A single dB(A) number cannot show either.
Walls and the path difference
A wall helps because sound has to bend over the top, and the longer path costs energy. The measure is the path difference : the length of the shortest path over the top of the wall, minus the straight line from the source to the receiver. The Fresnel number compares that to the wavelength :
Maekawa’s formula turns it into an estimate of the attenuation of a thin, solid wall for a point source:
Two things follow. First, a low-frequency sound has a long wavelength, so the same wall helps less against a hum than against a hiss. Second, the formula only gives a positive number when the wall breaks the line of sight.
Here is a worked case. The source is 2 m above the ground, the receiver is 50 m away at 1.5 m, and a wall 4 m high stands 10 m from the source. At 500 Hz the wavelength is 0.69 m (343 m/s divided by 500 Hz). The path over the top is 0.27 m longer than the straight line, so and the wall takes off dB. The same wall takes off 12.2 dB at 100 m and 11.9 dB at 200 m.
Now put the unit on a roof 16 m up, with the same wall on the ground and the same receiver. The straight line from the unit to the receiver passes 9 m above the top of the wall. The wall does not break the line of sight, and the attenuation is 0 dB. A ground wall does nothing for rooftop plant, and rooftop plant is where much of the cooling equipment sits.
Read the chart at 50 m. One unit with no wall is 57.9 dB(A) and one unit behind the wall is 45.1. Ten units are 67.9 with no wall and 55.1 behind the wall. The wall bought about 12 dB, and ten units took 10 dB of it back.
Ground, directivity and everything else
The chart leaves out terms that a permit study cannot.
- Ground. Hard pavement reflects sound and adds to the level near the source. Grass and soil absorb some of it, and by a different amount in each octave band.
- Directivity. A fan that discharges upward is louder overhead than at the side. Louvers and exhausts face one way. A point source that radiates equally in all directions is a simplification.
- Buildings. A building between the yard and the neighbor screens sound, and a wall behind a unit reflects it. A single thin wall is the easy case.
- Tones. A pure tone is more annoying than broadband noise of the same level, and many ordinances add a penalty for it.
- Weather and terrain. Wind direction, temperature gradients, berms and ridges change the result.
What a permit-grade study needs
Permit work follows a named method. For outdoor sound the usual one is ISO 9613-2, which works in octave bands from 63 Hz to 8 kHz. Each band has its own spreading, air absorption, ground effect and screening, and the bands are summed after A-weighting. It needs the manufacturer’s octave-band sound power data for each unit. A single dB(A) rating hides which bands carry the energy. The study also needs source directivity, building screening, and the limits that the local rule sets, which often differ by day and night.
Jurisdictions ask for more than a number. As one public example, Fairfax County, Virginia’s data center zoning standards require a noise study that demonstrates compliance with the county noise ordinance before site plan approval. They require a second study, with measurements of the installed equipment, before the use permit is issued. Ask the jurisdiction which credentials it wants on the study and sign-off, because that varies. A calculation from software, however careful, does not substitute for that.
Where CoolSim stands
The noise check in the CoolSim site editor is a screening estimate. You place sources with their sound power, walls and receivers on the site. It shows the level at each receiver against a limit you type in, and a map across the site. It uses the published terms of the ISO 9613-2 method: spreading, air absorption, ground reflection and screening by walls over the top and around the ends. The method works in octave bands, but every source in the editor is a single dB(A) number, so the estimate runs on the terms for the 500 Hz band. We have not run it against the standard’s official test cases, so it does not claim conformance.
What it leaves out is exactly the list above:
- No source directivity. Every source radiates equally in all directions.
- No building screening or reflection. Only walls screen.
- No terrain.
- No day and night limits, and no low-frequency or tone check.
- Sources are one dB(A) number each, not a manufacturer’s octave-band data.
- Results live in the editor. They are not part of a solve, a report or an export.
Use it for relative questions on one layout: does moving the generator 20 m farther help more than a 3 m wall, and is the layout obviously over? Do not use it to prove a pass, and do not hand it to a reviewer. It is not a studies service, and we do not offer it as one. A marginal pass in the editor should be treated as a fail until an acoustician has worked it through with real data.
What to do next
Start with the spreading and the count of units, because that arithmetic is right in any tool. Put the loudest and the most numerous plant as far from the property line as the site allows, and check wall heights against where each unit sits and not only where the neighbor is. Then give your acoustician the layout and the data sheets. If you want to see how we check our own models, read how we know it’s right, or contact us with a site and a question.