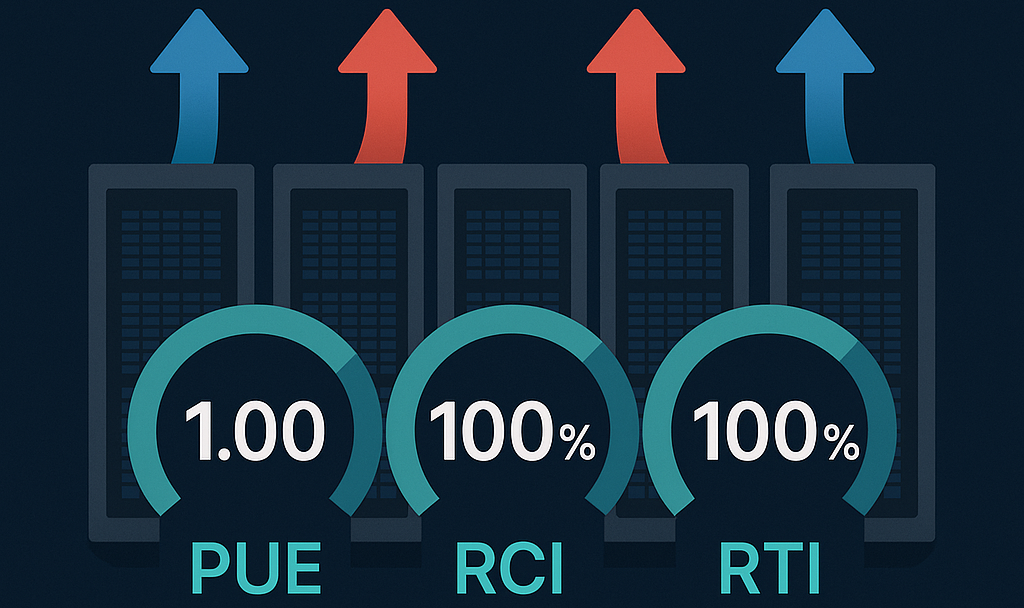
An operator usually wants two things from a data hall: equipment that gets air it can use, and a cooling bill that isn’t larger than it needs to be. Three metrics each answer part of that.
- Power Usage Effectiveness (PUE) measures the energy the whole facility spends on top of its IT load.
- Rack Cooling Index (RCI) measures how many equipment intakes sit outside the ASHRAE temperature range, and by how much.
- Return Temperature Index (RTI) measures whether the cooling units move more or less air than the equipment draws.
None of the three is enough on its own. This article defines each one, works an example, and says what each leaves out.
Power Usage Effectiveness (PUE)
The Green Grid introduced PUE in 2007. It is the ratio of the energy the whole facility uses to the energy delivered to the IT equipment:
IT equipment means the servers, storage and network gear. The power chain that feeds them (transformers, UPS systems, PDUs) is facility overhead, the same as cooling and lighting, and its losses count on the facility side. The Green Grid’s guidance is to meter IT energy at the UPS output at a minimum, and closer to the equipment (at the PDU output, or at the equipment itself) where the metering allows. The closer the meter, the fewer distribution losses end up counted as IT. PUE is meant to be calculated from a full year of energy, because cooling overhead changes with the weather.
A PUE of 1.0 would mean every kilowatt-hour reaches the IT equipment. At 1.54, a hall with 1 MW of IT load draws 1.54 MW in total, and 0.54 MW goes to cooling, power distribution and everything else.
1.54 is the weighted average across 681 facilities in the Uptime Institute’s 2025 Global Data Center Survey, and Uptime reports it has barely moved for six consecutive years:
| Uptime Institute, 2025 survey | PUE |
|---|---|
| All respondents, weighted average | 1.54 |
| Facilities commissioned since about 2020 | 1.48 |
| Facilities of 20 MW and above | 1.44 |
15% of respondents reported a PUE of 1.3 or better, many of them new facilities at high latitudes in North America and Europe.
What PUE leaves out
- Where the overhead goes. Cooling, UPS losses and lighting land in one number. PUE says how large the overhead is, not which part of it to fix.
- Server fans count as IT. Raising the supply air temperature can make server fans speed up. IT energy rises, cooling energy falls, and PUE can improve even when the total bill does not.
- Useful work. A hall of idle servers can post a good PUE.
- Climate. A site in a cool, dry climate can reject heat to outside air for more of the year than one in a hot, humid climate. Comparing PUE across regions compares weather as much as design.
For a decision about one room, the question is usually narrower: how much cooling and fan energy can the room shed without putting any equipment intake out of range? The next two metrics are built for that question.
Rack Cooling Index™ (RCI)
RCI was developed by Magnus Herrlin of ANCIS Incorporated, which holds the trademark. It condenses every equipment intake temperature in a room into two numbers, one for each end of a temperature range. The range is usually ASHRAE’s.
The ASHRAE range
ASHRAE Technical Committee 9.9 publishes the Thermal Guidelines for Data Processing Environments; the current edition is the 5th (2021). In 2024 ASHRAE moved the guidelines online, into its TC 9.9 Datacom Encyclopedia. The guidelines give two ranges for intake air:
- The recommended range is a statement of reliability: where manufacturers recommend the equipment operate for extended periods.
- The allowable range is a statement of function: where manufacturers test that the equipment will run.
| Class | Recommended | Allowable |
|---|---|---|
| A1 | 64.4–80.6 °F (18–27 °C) | 59.0–89.6 °F (15–32 °C) |
| A2 | 64.4–80.6 °F (18–27 °C) | 50–95 °F (10–35 °C) |
| A3 | 64.4–80.6 °F (18–27 °C) | 41–104 °F (5–40 °C) |
| A4 | 64.4–80.6 °F (18–27 °C) | 41–113 °F (5–45 °C) |
| H1 | 64.4–71.6 °F (18–22 °C) | 59–77 °F (15–25 °C) |
Class H1 is new in the 5th edition. It covers zones cooled to lower temperatures for high-density air-cooled equipment. The rest of this article uses class A1: recommended 64.4–80.6 °F, allowable 59.0–89.6 °F.
Definition
where:
- is the temperature at equipment intake
- is the total number of intakes, including those inside the range
- and are the maximum recommended and allowable temperatures (80.6 °F and 89.6 °F)
- and are the minimum recommended and allowable temperatures (64.4 °F and 59.0 °F)
Only intakes outside the recommended range add to the sum, but counts every intake. That is what lets RCI describe the room: divided by only the intakes outside the range, one hot rack in a room of a thousand would score the same as a thousand hot racks. The numerator is the room’s total over-temperature. The denominator is the total over-temperature the room would have if every intake sat exactly at the allowable limit.
So RCIHI is 100% when no intake is above the recommended maximum, falls as intakes rise above it, and reaches 0% when the total over-temperature equals every intake sitting at the allowable limit. It can fall below 0%. Because an average can hide a single intake above the allowable limit, Herrlin marks the result with an asterisk when any intake is outside the allowable range, for example RCIHI = 85%*. RCILO works the same way at the cold end.
Herrlin’s rating scale (Herrlin, 2010):
| RCI | Rating |
|---|---|
| 100% | Ideal: no intake outside the recommended range |
| 96% or more | Good |
| 91–95% | Acceptable |
| 90% or less | Poor |
A worked example
Consider ten racks, one intake each:
| Rack | Intake (°F) |
|---|---|
| 1 | 68.0 |
| 2 | 71.6 |
| 3 | 77.0 |
| 4 | 82.4 |
| 5 | 86.0 |
| 6 | 78.8 |
| 7 | 66.2 |
| 8 | 91.4 |
| 9 | 75.2 |
| 10 | 73.5 |
Three intakes are above the recommended 80.6 °F:
| Rack | Intake (°F) | Above 80.6 °F by |
|---|---|---|
| 4 | 82.4 | 1.8 |
| 5 | 86.0 | 5.4 |
| 8 | 91.4 | 10.8 |
| Total | 18.0 |
With :
Rack 8, at 91.4 °F, is above the allowable 89.6 °F, so the result is reported as RCIHI = 80%*. On Herrlin’s scale that is poor, and the asterisk says at least one piece of equipment is running outside the range its manufacturer tested.
No intake is below 64.4 °F (the coldest is rack 7, at 66.2 °F), so RCILO = 100%.
What RCI leaves out
RCI says how much of the room is out of range, not where. Two rooms with the same RCIHI can have their hot racks in one corner or spread across every row. To find the problem you still need the rack-by-rack intake temperatures; RCI is the one-line summary of them.
RCI also depends on the range chosen. The same room scores lower against class H1 than against A1. The CoolSim report computes RCI against the ASHRAE 2008 limits for Class 1 equipment (recommended 64.4–80.6 °F, allowable 59–90 °F), so its RCIHI reads slightly higher than the same room scored against A1.
And it says nothing about energy. A room can reach 100% by supplying far more cold air than its equipment needs. That is what RTI measures.
Return Temperature Index™ (RTI)
RTI, also Herrlin’s and also an ANCIS trademark, asks whether the cooling units move the same amount of air as the equipment draws:
where and are the airflow-weighted average return and supply temperatures at the cooling units, and is the airflow-weighted average temperature rise across the equipment.
A ratio of temperatures measures airflow because of an energy balance. In a steady state, the heat the equipment adds to the air is the heat the cooling units take out, less whatever passes through the walls and floor. The heat an airstream carries is
Writing it once for the equipment and once for the cooling units, with the same and :
so
RTI is the equipment’s airflow as a percentage of the cooling units’ airflow. A model knows both airflows directly, so the CoolSim report computes RTI from them rather than from temperatures.
| RTI | Airflow | What happens |
|---|---|---|
| 100% | Balanced | The units supply what the equipment draws |
| Below 100% | Net bypass | The units supply more than the equipment draws; the surplus returns to the units without passing through any equipment, and the return temperature drops |
| Above 100% | Net recirculation | The equipment draws more than the units supply; the difference is made up by equipment exhaust drawn back into intakes |
A worked example
A room carries 400 kW of IT load, and the equipment raises the air temperature by 20 °F on average. At sea-level air density the equipment draws about
If the cooling units supply 80,000 CFM, then
About 16,800 CFM, a fifth of what the units move, returns without passing through a rack. The units see a temperature difference of 0.79 × 20 °F ≈ 15.8 °F instead of 20 °F. With 65 °F supply air, the return is about 81 °F instead of 85 °F.
What RTI leaves out
RTI measures the net. A room with bypass in one aisle and recirculation in another can read 100%; the enterprise room in The Evolution of Data Center Design is one. It is most useful read next to RCI:
- RTI below 100% with RCIHI at 100% suggests the room could supply less air.
- RTI below 100% with RCIHI below 100% says the air is there but not reaching the intakes that need it. That is a distribution problem, not a capacity problem.
Reading the three together
PUE says what the facility spends on overhead. RCI says whether the equipment intakes are in range. RTI says whether the airflow is balanced.
Most changes move them against each other. Turning off a cooling unit raises RTI and lowers the cooling energy behind PUE, and it may lower RCI. Deciding whether the trade is worth it takes the intake temperatures rack by rack, before and after the change. That is what an airflow model provides; WP108 works through the cooling-unit case on one room.
Sources
- The Green Grid, PUE: A Comprehensive Examination of the Metric, White Paper 49.
- Uptime Institute, Global Data Center Survey 2025.
- ASHRAE TC 9.9, Thermal Guidelines for Data Processing Environments, 5th edition (2021), now part of the TC 9.9 Datacom Encyclopedia.
- M. K. Herrlin, Data Center Air Management Research, PG&E Emerging Technologies Program, Application Assessment Report 0912 (2010). Defines RCI and RTI as used here.