Natural Convection
Natural convection is heat transfer driven by buoyancy rather than fans or blowers. When air is heated by equipment, it becomes less dense and rises; cooler air flows in to replace it, creating a passive circulation loop. For lower-density data centers, telecom shelters, and edge sites, this can be an effective cooling strategy—and CoolSim can help you evaluate whether it will work for your facility.
This guide walks you through setting up a natural convection analysis in CoolSim, from building your layout to interpreting the results.
Setting Up Your Geometry and Layout
The first step in any CoolSim analysis is building a model that reflects your physical space. For natural convection, a few layout details matter more than they would in a typical forced-air simulation.
Room dimensions and ceiling height have a direct impact on how well buoyancy-driven airflow develops. Taller spaces give warm air more room to rise and create stronger circulation. When defining your room geometry, make sure the ceiling height accurately reflects the actual space—approximations that work fine for forced-air models can meaningfully affect natural convection results.
Equipment placement should reflect real-world positions as closely as possible. In a natural convection scenario, dense clusters of equipment can create stagnant zones where warm air has no clear path upward. Pay attention to aisle widths, clearance above racks, and any overhead obstructions like cable trays or lighting that could block vertical airflow.
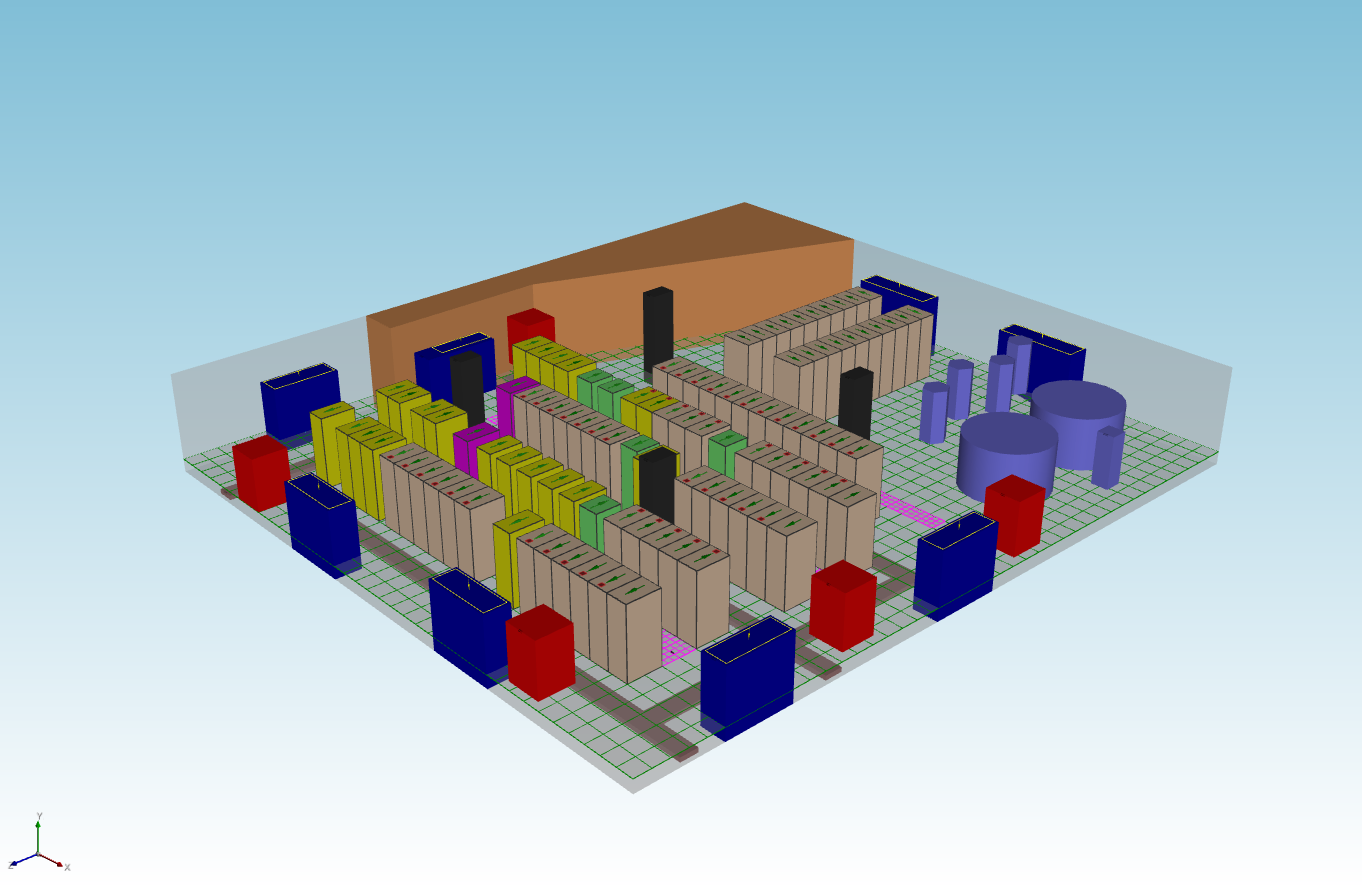
The image above shows an example CoolSim layout built for natural convection analysis. Each colored block represents a different equipment type—servers, network switches, PDUs, storage, and cooling units. Notice how the equipment is spaced to allow open vertical paths for air to rise.
Assigning Heat Loads and Boundary Conditions
Once your geometry is in place, you need to tell CoolSim how much heat each piece of equipment generates and what the thermal environment looks like.
Heat loads should be assigned to every piece of equipment that dissipates power. Use nameplate ratings as a starting point, but actual measured power draw will give more accurate results if available. For natural convection, getting the heat distribution right is especially important—concentrated hot spots behave very differently than evenly distributed loads when there are no fans to mix the air.
Boundary conditions define the thermal environment surrounding your model. At minimum, you’ll need to specify the ambient air temperature entering the space and the thermal properties of the room boundaries (walls, ceiling, floor). For natural convection, these boundaries matter more than in forced-air cases because the buoyancy-driven flow is weaker and more sensitive to environmental conditions. If the room has openings, vents, or passive intake louvers, model those as well—they define where cool replacement air enters the space.
If your facility uses a hybrid approach with some active cooling units alongside passive zones, include the active units in your model with their rated capacities. CoolSim will capture the interaction between forced and natural airflow in the results.
Interpreting Your Results
After the simulation runs, CoolSim produces temperature and airflow visualizations throughout the modeled space. For natural convection analyses, focus on a few key outputs.
Temperature distribution is the most important result. Look for hot spots—areas where equipment surface or inlet temperatures exceed your thermal limits. In natural convection models, hot spots tend to appear where warm air pools beneath obstructions, in tightly packed equipment clusters, or in areas far from cool air sources. If equipment in these zones is above acceptable thresholds, you may need to adjust spacing, relocate high-power equipment, or introduce targeted active cooling.
Airflow patterns show how buoyancy is driving circulation through the space. In a well-designed natural convection layout, you should see warm air rising above equipment and cool air flowing in at lower elevations. Look for stagnant zones where air velocity is near zero—these indicate areas that aren’t receiving adequate cooling. Also watch for recirculation, where warm exhaust air loops back into equipment intakes instead of rising away.
Thermal plumes above high-power equipment are normal and expected. What matters is whether those plumes dissipate before reaching neighboring equipment or whether they stack on top of each other and create a cumulative heating problem. If you see plume stacking, consider increasing the spacing between high-power racks or lowering the heat load in that zone.
When to Add Forced Cooling
If your natural convection results show temperatures outside acceptable limits, that doesn’t mean the approach has failed—it means you’ve identified where active cooling is needed. Many facilities benefit from a hybrid design: natural convection handles the base load in lower-density areas while CRAC units or in-row coolers target the high-density zones. CoolSim lets you model both approaches in the same simulation to find the right balance.
Next Steps
With your first natural convection model complete, consider running parametric studies to test how results change with different equipment arrangements, heat loads, or ambient conditions. CoolSim makes it straightforward to duplicate a model, adjust variables, and compare outcomes—helping you converge on a design that maximizes passive cooling while keeping every rack within thermal limits.
For additional guidance, visit www.coolsimsoftware.com or contact our engineering support team.