Introduction
Every CoolSim summary report includes a Data Center Energy Report. It has eight lines: the coefficient of performance (COP), power usage effectiveness (PUE), data center infrastructure efficiency (DCIE), the return temperature index (RTI), the high and low rack cooling indices (RCIHI and RCILO), total facility power and annual operating cost. Two of those lines are read from the airflow solution. The other six are arithmetic on figures you enter and on the room’s heat load.
This note is a new edition of TN101, first published in 2012. It shows how each line is computed and works every line through for one room. It then runs the room a second time with the airflow moved around, to show which lines respond to the airflow and which do not.
The Example Room
The room is the one studied in WP110 [5] and WP112 [6]: 124 ft by 57.5 ft, with 234 racks at 4 kW each, 936 kW in total, in seven enclosed hot aisle pairs. Eighteen cooling units line the two long walls, labeled U1 to U9 along the upper wall and L1 to L9 along the lower wall, numbered from the left. Each supplies about 6,500 CFM, 117,000 CFM in total, at 60°F (L1 at 65°F), and the racks draw about 114,300 CFM. The walls neither gain nor lose heat, and there are no PDUs, so the IT load is the rack load, 936 kW.
The energy inputs for the example (Table 1) are round figures chosen to illustrate the arithmetic, not measurements from a real site.
Table 1. Energy inputs for the example room.
| Input | Value | What it covers |
|---|---|---|
| Coefficient of performance (COP) | 3.5 | Heat removed per unit of power drawn by the chillers, condensers and other heat rejection equipment, not counting the cooling-unit fans |
| Fan power | 63 kW | The cooling-unit fans, 3.5 kW per unit |
| Other power | 47 kW | Lights and other loads in the room besides the IT equipment, about 5% of the IT load |
| Cost of electricity | $0.10 per kWh |
If no COP is entered, the report cannot work out the cooling power. It shows COP as Not Specified and NA for PUE, DCIE, total facility power and annual operating cost. RTI, RCIHI and RCILO are reported either way, because they do not use the energy inputs. The inputs can be entered in the report itself: its energy calculator recomputes these lines in the browser without running the job again. A measured cooling power can be entered in place of a COP.
How Each Line Is Computed
Total thermal load is the heat the cooling has to remove:
The fans are included because the power that drives them ends up as heat in the room. Wall heat gain is negative if the room loses heat through its walls.
Cooling power is the power the chillers, condensers and other heat rejection equipment draw to remove that heat:
A measured cooling power, if entered, takes the place of .
Total facility power is everything the site draws, as far as the inputs describe it:
Each input appears once. Wall heat does not appear: heat that comes in through the walls costs cooling power to remove, but it is not electricity the site buys.
PUE and DCIE. Power usage effectiveness, as defined by The Green Grid [2], is total facility power divided by IT power. DCIE is its inverse, as a percentage:
Annual operating cost holds the total facility power for a full year, 8,760 hours, at the cost of electricity:
Table 2 works each line through for the example room.
Table 2. The energy lines for the example room.
| Line | Calculation | Result |
|---|---|---|
| Total thermal load | 936 + 0 + 47 + 63 kW | 1,046 kW |
| Cooling power | 1,046 kW ÷ 3.5 | 298.9 kW |
| Total facility power | 936 + 47 + 63 + 298.9 kW | 1,344.9 kW |
| PUE | 1,344.9 ÷ 936 | 1.44 |
| DCIE | 100% ÷ 1.437 | 69.6% |
| Annual operating cost | 1,344.9 kW × 8,760 h × $0.10 per kWh | $1,178,095 |
Of the 1,344.9 kW, 936 kW (70%) reaches the IT equipment. The cooling plant takes 298.9 kW, the fans 63 kW and the other loads 47 kW.
The Same Energy Lines for a Different Room
The room was then run a second time with 40% of the airflow moved from the six cooling units at its left end, U1 to U3 and L1 to L3, to the other twelve, as in WP112 [6]. The total airflow, the racks, the supply temperature and the energy inputs were unchanged.
Figure 1 shows what changed. As built, the cooling units each removed between 39 and 58 kW. After the shift, the six units at the left end removed 28 to 34 kW each, and the units that took their air removed up to 66 kW.
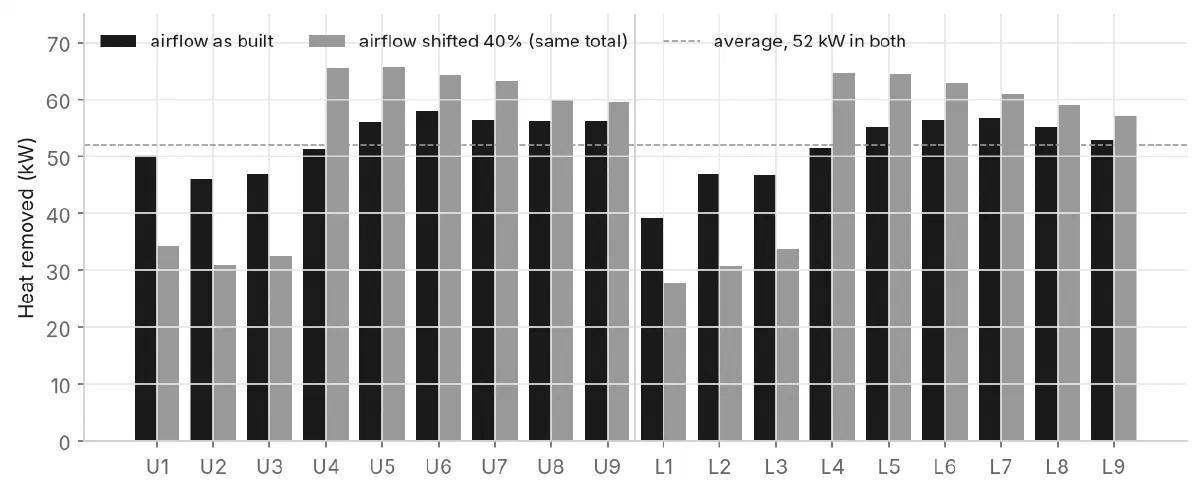
Figure 1
Heat removed by each cooling unit with the airflow as built (black) and with 40% of the airflow moved from U1–U3 and L1–L3 to the other twelve units (gray). The total is about 937 kW in both runs, and the energy report gives the same PUE, DCIE, total facility power and annual cost for both
Every line of the energy report came out the same for both runs except RCILO, which moved from 29.09% to 28.66%. That follows from the definitions above. PUE, DCIE, total facility power and annual cost depend on the IT load, the wall heat and the inputs. The walls here neither gain nor lose heat, so none of those changed. The energy lines cannot tell these two rooms apart; the cooling unit and rack results can.
RTI Comes From the Inputs Too
Herrlin [4] defines the return temperature index from temperatures: the temperature drop across the cooling units divided by the temperature rise across the IT equipment. When all of the heat is carried by the air, that is the same as the airflow drawn by the IT equipment divided by the airflow supplied by the cooling units. The report uses that second form, with the airflows entered in the model:
Below 100%, the cooling units supply more air than the racks draw. Above 100%, the racks draw more air than is supplied, and some of it has to come around again from their exhausts. Because it uses the airflows as entered, RTI was 97.69% in both runs. It describes the design, not where the air went.
RCI: The Lines That Read the Solution
The rack cooling index [3] measures how far rack inlet temperatures fall outside the ASHRAE recommended range [1]. It measures that as a share of the band between the recommended and allowable limits. The report computes one index for each side, with temperatures in °F:
where:
- is the hottest point on the inlet of rack , and the first sum runs over the racks where it is above the recommended maximum, 80.6°F.
- is the coldest point on the inlet of rack , and the second sum runs over the racks where it is below the recommended minimum, 64.4°F.
- 90.0°F and 59.0°F are the allowable limits the report uses. ASHRAE’s Class A1 allowable maximum is 89.6°F (32°C).
- is the number of racks in the room.
An index of 100% means no rack is outside the recommended range. Herrlin [3] rates 96% and above as good, 91% to 95% as acceptable, and 90% and below as poor. The example room shows two consequences of the definition.
RCIHI weighs how far over, not how many
The supply air was raised from 60°F to 72°F in 4°F steps with the airflow as built, as in WP112 [6]. The counts in Table 3 use the hottest point on each rack inlet in the same solution the report reads.
Table 3. Racks over the recommended maximum, and RCIHI, as the supply air is raised.
| Supply air | Racks over 80.6°F | Hottest rack inlet | RCIHI |
|---|---|---|---|
| 60°F | 0 | 76.9°F | 100% |
| 64°F | 7 | 81.4°F | 99.9% |
| 68°F | 52 | 85.9°F | 93.8% |
| 72°F | 100 | 90.4°F | 78.9% |
At 64°F, 7 racks are over the recommended maximum and the index is 99.9%, rated good. At 68°F, 52 racks, more than one in five, are over and the index is 93.8%, rated acceptable. The index averages the excess over every rack in the room, so many racks slightly over and a few racks well over can give the same value. Read it together with the number of racks over the limit, which the report’s rack inlet results show.
The report reads the solution at the end of the run. WP112 [6] ran the same cases on past the end of the run, with a snapshot every 25 iterations, and found between 4 and 8 racks over at 64°F. A single RCI value carries that spread with it.
RCILO takes each rack’s coldest point
At a 60°F supply, the coldest point on every one of the 234 rack inlets is below the 64.4°F recommended minimum (Figure 2, top). RCILO is 29.1%, rated poor. Averaged over each inlet, 158 racks are below the minimum (Figure 2, bottom), and the same index computed from those averages would be 77.5%. (WP112 [6] counted 152 to 157 over its snapshots; the report reads one solution.)
Both say the room is over-cooled, as WP112 [6] found. The report says it more strongly, because in a room supplied at 60°F some part of nearly every rack inlet sees air close to 60°F. At a 64°F supply, 104 racks still have a coldest point below 64.4°F, since the supply itself is 0.4°F under it, but none are below it on average. There, RCILO is 98.9%.
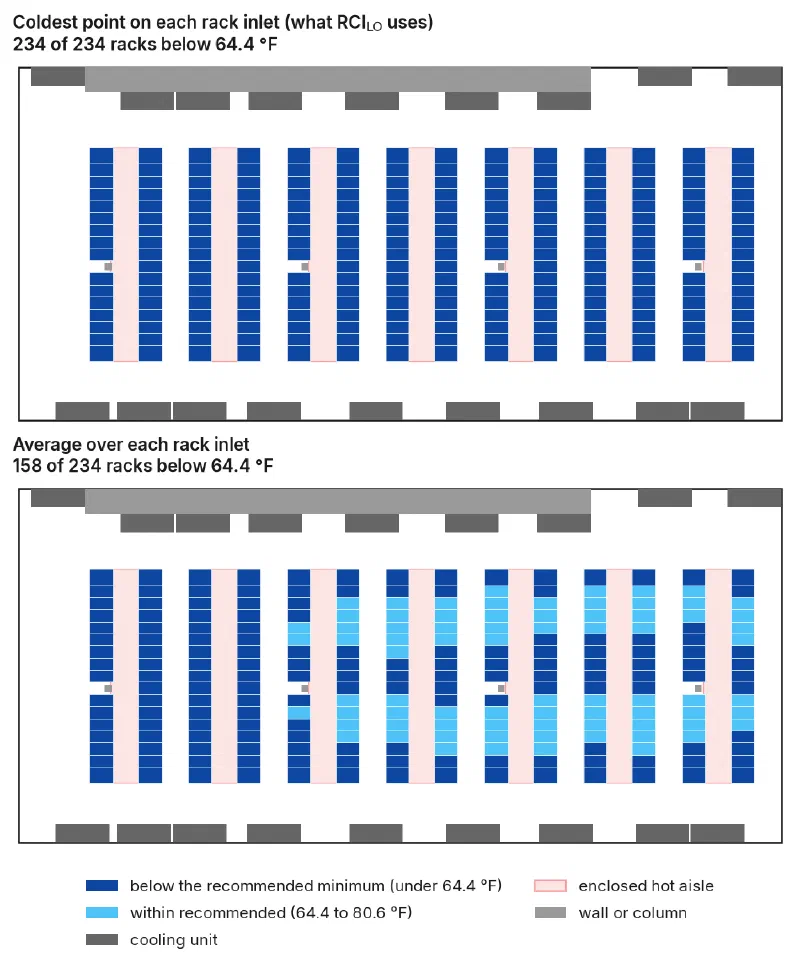
Figure 2
Each rack colored by its inlet temperature at a 60°F supply: the coldest point on each inlet (top), which the report’s low-side rack cooling index uses, and the average over each inlet (bottom). Dark blue is below the 64.4°F recommended minimum; light blue is within the recommended range
What the Report Does Not Include
- A COP that changes. COP is one number. In practice it rises with the supply and chilled water temperatures and changes with the weather and the load. Raising the supply air, the subject of WP112 [6], leaves the report’s PUE unchanged.
- Modeled fan power. Fan power is entered, not computed from the airflow in the model.
- More than one operating point. The annual cost holds the facility power constant for 8,760 hours: no part load, no seasons, no economizer hours.
- Anything not entered. Pumps, cooling towers, UPS and distribution losses, and lighting outside the room are in the PUE only if they are included in the COP or the other power. A PUE from the report is comparable with a metered PUE [2] only if it covers the same loads.
- Humidity. Humidification and dehumidification are not included. ASHRAE’s recommended range has humidity limits as well as temperature limits [1].
Conclusions
- The energy lines are arithmetic on the inputs. PUE, DCIE, total facility power and annual cost depend on the IT load, the wall heat and the figures entered. Two runs of the same room gave identical values, although the cooling units removed 39 to 58 kW each in one and 28 to 66 kW in the other.
- RTI comes from the airflows entered, not the solution: IT equipment airflow divided by cooling unit airflow.
- RCIHI and RCILO read the solution. They take each rack’s hottest and coldest inlet point, and they weigh how far outside the recommended range, not how many racks. At a 68°F supply, 52 racks were over the recommended maximum and RCIHI was 93.8%.
- Use each line for what it measures. The energy lines give a consistent estimate from the inputs. The rack and cooling unit results show whether the airflow works.
References
- ASHRAE Technical Committee 9.9, Thermal Guidelines for Data Processing Environments, 5th ed., ASHRAE, 2021.
- The Green Grid, PUE: A Comprehensive Examination of the Metric, White Paper #49, 2012.
- M. K. Herrlin, “Rack Cooling Effectiveness in Data Centers and Telecom Central Offices: The Rack Cooling Index (RCI),” ASHRAE Transactions, vol. 111, part 2, 2005.
- M. K. Herrlin, “Airflow and Cooling Performance of Data Centers: Two Performance Metrics,” ASHRAE Transactions, vol. 114, part 2, 2008.
- WP110: Adding AI Racks to an Air-Cooled Data Center, CoolSim, 2026.
- WP112: How Warm Can the Supply Air Go?, CoolSim, 2026.
RTI and RCI are trademarks of ANCIS Incorporated.