Introduction
Power usage effectiveness (PUE) is the power a data center draws divided by the power its IT equipment draws [2]. Outside the IT equipment, most of the rest goes to cooling. In the example worked through in TN101 [3], the cooling plant and the cooling-unit fans take 362 kW of the 409 kW that does not reach the IT equipment, 88%.
Airflow management means containment panels, blanking panels, sealed cable openings: anything that keeps the cold supply air and the hot exhaust apart. It is often described as a way to lower PUE, but it does not do that by itself. The cooling plant has to remove the heat the room makes whatever path the air takes on the way, and TN101 [3] showed that PUE follows from that heat and the plant’s efficiency, not from where the air goes. What airflow management changes is how much of the hot exhaust gets back into the rack inlets, and so how much margin the racks have. PUE falls only when that margin is spent: on less air, on fewer units running, or on warmer supply air.
This paper is a new edition of WP103, first published in 2010. It uses CoolSim to measure that margin in the 234-rack room studied in WP110 to WP112 [4, 5, 6], which has panels enclosing each hot aisle, by solving the same room with the panels and without them. It then works out what the difference is worth, with the energy inputs used in TN101 [3].
The Example Room
The room is 124 ft by 57.5 ft, with a slab floor, an 11.75 ft ceiling and a 21 in. plenum above the ceiling. It holds 234 racks at 4 kW each, 936 kW in total, in 14 rows that form seven hot aisle pairs. Eighteen cooling units line the two long walls, labeled U1 to U9 along the upper wall and L1 to L9 along the lower wall, numbered from the left. Each supplies about 6,500 CFM, 117,000 CFM in total, at 60°F (L1 at 65°F), blowing out along the aisles at floor level. The racks draw about 114,300 CFM, 98% of what the units supply.
Above each hot aisle, a ceiling grille 4.8 ft wide and 34.8 ft long opens into the plenum, which carries the exhaust back to the tops of the cooling units. Each hot aisle is enclosed by four panels from the floor to the ceiling: one along each rack row, which closes the space above the racks, and one across each end. In the model, each panel lets a little air through, as a plate 5% open would.
The comparison in this paper takes the 28 panels out and changes nothing else (Figure 1). The grilles stay where they are, so the exhaust still has a way out directly above each hot aisle; it is no longer kept from going anywhere else.
Without panels
With panels
Figure 1
One hot aisle pair, drawn schematically. Without panels, the ceiling grille takes part of the exhaust and the rest can come back over and around the rows into the rack fronts. With panels, the exhaust can leave only through the grille
How the Room Was Modeled
Each case was built and solved with CoolSim’s standard model setup, the same one used for customer jobs, and had to pass the same convergence checks before results were taken. Both versions of the room were meshed the same way; the one with panels has 530,499 cells and the one without has 512,763; the panels account for the difference. With panels, this mesh reads within 1°F of the one used in WP110 to WP112 at the hottest rack inlet, and neither puts any rack over a limit. The cooling units in the model always supply air at their set temperature, whatever the load.
Each rack is judged by the hottest point on its inlet face, against the ASHRAE limits for class A1 equipment [1]: recommended up to 80.6°F, allowable up to 89.6°F.
A solved room of this size never sits perfectly still, so each case was reopened and run on for another 500 iterations, with a snapshot every 25. Reopening a solved case disturbs it for 50 to 135 iterations, so the snapshots taken before its residuals were back under the limits that ended the run are left out. One case, without panels and with 30% more air, levels off with its residuals just above those limits while its temperatures stay flat; its snapshots are kept from the point its residuals are back within half again of where they level off. That leaves 15 to 18 snapshots of each case. Counts in the tables are the range over them; the figures show each rack’s median.
Results
With the panels in place, every rack is within the recommended range, and the hottest rack inlet is 77.4 to 77.8°F, about 3°F under the limit (Figure 2 and Table 1).
Take the panels out and change nothing else, and 125 to 130 of the 234 racks go over the recommended limit, 42 to 45 of them over the allowable limit as well. The hottest rack inlet is 93.2 to 93.3°F. Of the 128 racks over in Figure 2, 118 are in the five hot aisle pairs on the right, and 118 are in the outer thirds of their rows, toward the walls the units stand on.
The same holds with a unit switched off. With U1 off, the room with panels still has every rack within the recommended range, at 78.4 to 78.7°F. Without panels, 156 to 158 racks are over the recommended limit and 53 to 56 over the allowable limit.
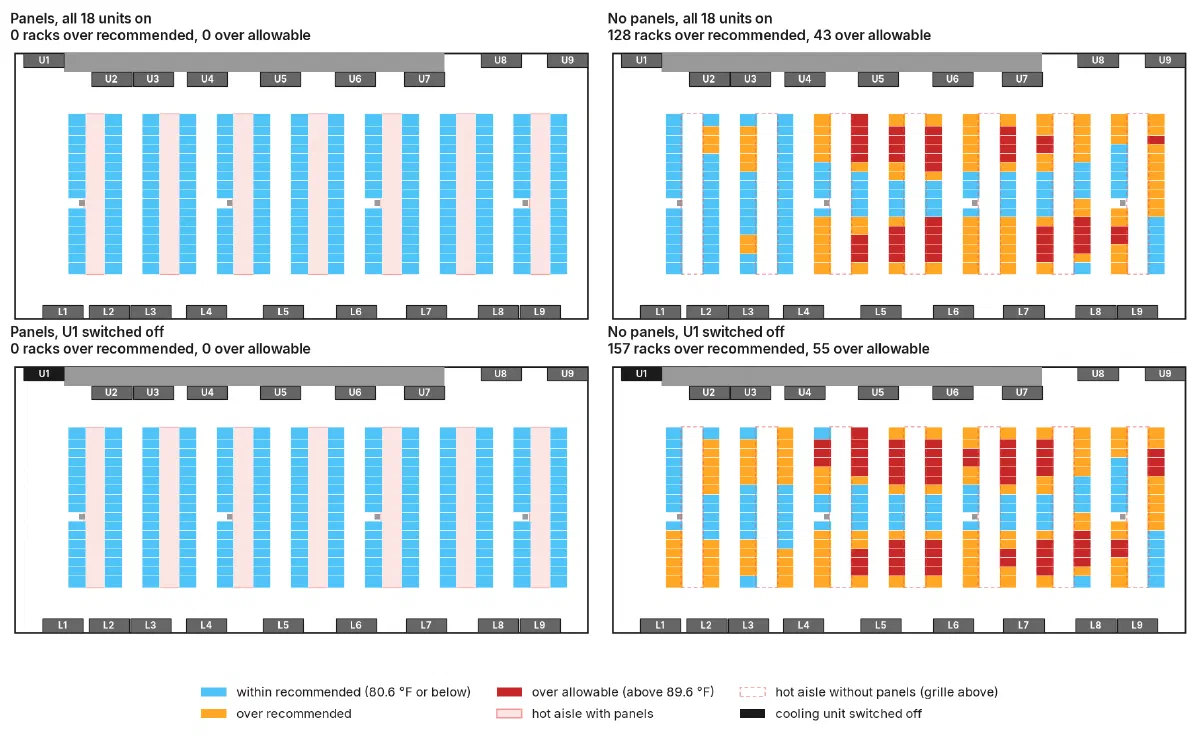
Figure 2
Each rack colored by its hottest inlet reading (median of the snapshots kept of each case), with the panels (left) and without them (right), with all 18 units on (top) and with U1 switched off (bottom). Without panels, each hot aisle is drawn as the dashed outline of its ceiling grille. The switched-off unit is shown in black
| Panels | Units running | Racks over recommended | Racks over allowable | Hottest rack inlet (°F) |
|---|---|---|---|---|
| yes | all 18 | 0 | 0 | 77.4–77.8 |
| no | all 18 | 125–130 | 42–45 | 93.2–93.3 |
| yes | 17 (U1 off) | 0 | 0 | 78.4–78.7 |
| no | 17 (U1 off) | 156–158 | 53–56 | 93.7 |
Table 1
Racks (of 234) whose hottest inlet reading is over the ASHRAE recommended (80.6°F) and allowable (89.6°F) limits, and the hottest rack inlet in the room, with and without the hot aisle panels. Ranges are over the 15 to 18 snapshots kept of each solved case
Without panels, the other way to keep exhaust out of the rack inlets is more air. The room without panels was solved again with every unit supplying 10%, 20% and 30% more air at the same temperature (Figure 3 and Table 2). Each 10% takes roughly 30 racks off the count, and 20% more brings every rack back under the allowable limit. At 30% more air, 152,100 CFM, 40 to 43 racks are still over the recommended limit, and the hottest rack inlet is 85.3 to 85.4°F, about 8°F warmer than the room with panels at today’s airflow.
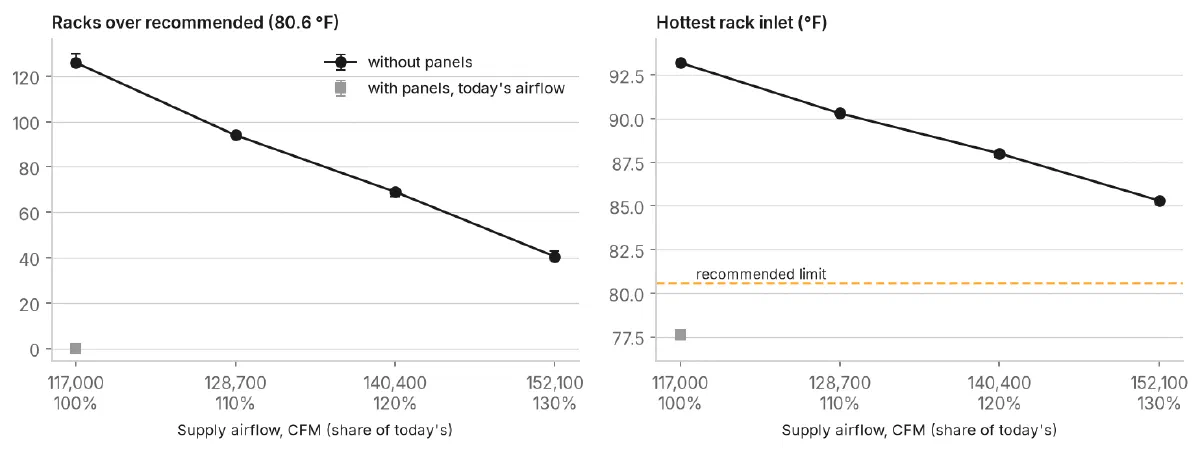
Figure 3
Racks over the recommended limit (left) and the hottest rack inlet (right) without panels as the supply airflow rises, against the room with panels at today’s airflow. Points are medians over the snapshots kept of each case, bars their range
| Supply airflow (CFM) | Share of today’s | Racks over recommended | Racks over allowable | Hottest rack inlet (°F) |
|---|---|---|---|---|
| 117,000 | 100% | 125–130 | 42–45 | 93.2–93.3 |
| 128,700 | 110% | 94 | 10 | 90.2–90.3 |
| 140,400 | 120% | 67–70 | 0 | 87.8–88.0 |
| 152,100 | 130% | 40–43 | 0 | 85.3–85.4 |
Table 2
The room without panels as every unit’s supply airflow rises, at the same supply temperature. Racks (of 234) whose hottest inlet reading is over the ASHRAE limits, and the hottest rack inlet in the room. Ranges are over the 15 to 18 snapshots kept of each solved case
What the Margin Is Worth
At today’s airflow, the panels do not change the room’s PUE. The plant removes the same 936 kW of rack heat with or without them, and the fans move the same air, so with TN101’s inputs [3] (a plant COP of 3.5, 47 kW of other loads, 3.5 kW of fan power per unit and electricity at $0.10/kWh) PUE is 1.437 either way. What the panels change is what the room can give up, and that is where the saving comes from (Table 3).
With panels, the margin can be spent. Switching off U1 keeps every rack within the recommended range and saves 4.5 kW: its 3.5 kW of fan power, and the 1.0 kW the plant used to remove that fan’s heat. That is $3,942 a year, and PUE falls to 1.432. WP111 [5] shows which other units in this room can be switched off, and WP112 [6] how much warmer the supply air can go.
Without panels, buying the margin back with air is expensive, because fan power rises with the cube of airflow. 10% more air costs 26.8 kW, $23,486 a year; 30% more costs 97.0 kW, $84,934 a year, and PUE rises to 1.540. Even then, 40 to 43 racks are still over the recommended limit.
| Case | Fan power (kW) | Total facility power (kW) | PUE | Electricity a year | Change a year |
|---|---|---|---|---|---|
| 18 units, today’s airflow | 63.0 | 1,344.9 | 1.437 | $1,178,095 | – |
| with panels, U1 off | 59.5 | 1,340.4 | 1.432 | $1,174,153 | −$3,942 |
| without panels, 110% airflow | 83.9 | 1,371.7 | 1.465 | $1,201,581 | +$23,486 |
| without panels, 120% airflow | 108.9 | 1,403.8 | 1.500 | $1,229,751 | +$51,656 |
| without panels, 130% airflow | 138.4 | 1,441.8 | 1.540 | $1,263,029 | +$84,934 |
Table 3
Fan power, total facility power, PUE and the electricity bill for each way of spending or buying back the margin, by TN101’s energy balance [3] with its inputs: 936 kW of IT, 47 kW of other loads, 3.5 kW of fan power per unit at today’s airflow and rising with the cube of airflow, a plant COP of 3.5 and electricity at $0.10/kWh. The first row holds with or without panels
What the Model Does Not Include
- Fan curves. Fan power is taken to rise with the cube of airflow, the fan affinity law for a fan working against the same system. A real unit’s fan power at a new airflow depends on its fan, its motor and drive, and the pressure it works against; the manufacturer’s data gives the real figure.
- Cooling unit capacity. The units hold their supply temperature, which assumes their coils can remove whatever heat reaches them.
- Plant efficiency. The cooling plant’s COP is held at 3.5 throughout, as in TN101 [3]. A plant supplied with warmer return air, or asked for warmer supply air, usually runs more efficiently, and that saving is not counted here.
- Other leaks. Blanking panels, cable openings and gaps under and between racks are not modeled. In a room without panels they add to the mixing measured here.
- Other rooms. These numbers belong to this room, with its ceiling return directly over each hot aisle. The method carries over.
Conclusions
- In this room, the panels are what keep the racks within range. With them, every rack is within the recommended range with about 3°F to spare. Without them, more than half the racks are over it, and 42 to 45 are over the allowable limit.
- The panels do not lower PUE by themselves. At today’s airflow, PUE is 1.437 with or without them.
- The margin they create can be spent. Switching off U1 keeps every rack within range and saves 4.5 kW, $3,942 a year.
- Air alone does not buy the margin back. 30% more air costs 97 kW, about $85,000 a year, raises PUE to 1.540, and still leaves 40 to 43 racks over the recommended limit.
- In a room without containment, the same model shows which racks are at risk and how much a set of panels would fix before anything is bought.
References
- ASHRAE Technical Committee 9.9, Thermal Guidelines for Data Processing Environments, 5th ed., ASHRAE, 2021.
- The Green Grid, PUE: A Comprehensive Examination of the Metric, White Paper #49, 2012.
- TN101: Data Center Energy Calculations in CoolSim, CoolSim, 2026.
- WP110: Adding AI Racks to an Air-Cooled Data Center, CoolSim, 2026.
- WP111: Which Cooling Unit Can You Afford to Lose?, CoolSim, 2026.
- WP112: How Warm Can the Supply Air Go?, CoolSim, 2026.