
CoolSim helps data center managers address two critical questions: Do you have sufficient cooling capacity for increasing IT loads, and where should you deploy additional equipment? Quickly develop CFD models to simulate normal operations and cooling unit failures, identify your most critical cooling units, and create comprehensive thermal management plans for your data center.
Accessible CFD modeling for Data Centers and AEC
Optimize data center cooling with CoolSim — an easy-to-use yet powerful CFD tool that cuts energy costs and prevents hot spots. See how our intuitive interface simplifies thermal modeling with a 30-day trial.


Why Choose CoolSim?
Effective CFD analysis with minimal hassle, flexible licensing options, and personalized support.
Ansys Fluent in the Cloud
Run high-fidelity airflow and thermal simulations in minutes—no local hardware required.
Drag-and-Drop Model Builder
Easily layout your data center with predefined objects for data center equipment.
Automated Reporting
Export high-resolution plots, output reports, and shareable hyperlinks in a click.
Trusted by data center builders worldwide


CoolSim Simulation Pipeline
-
1
Create Layout and Geometry
Design the physical layout of your data center, defining racks, CRACs, and room boundaries on your local machine using our intuitive client app.
-
2
Meshing
Automatically generate a high-quality computational mesh tailored to your geometry.
-
3
Solution
Run the Ansys Fluent CFD solver to simulate airflow, temperature distribution, and thermal loads.
-
4
Post-processing
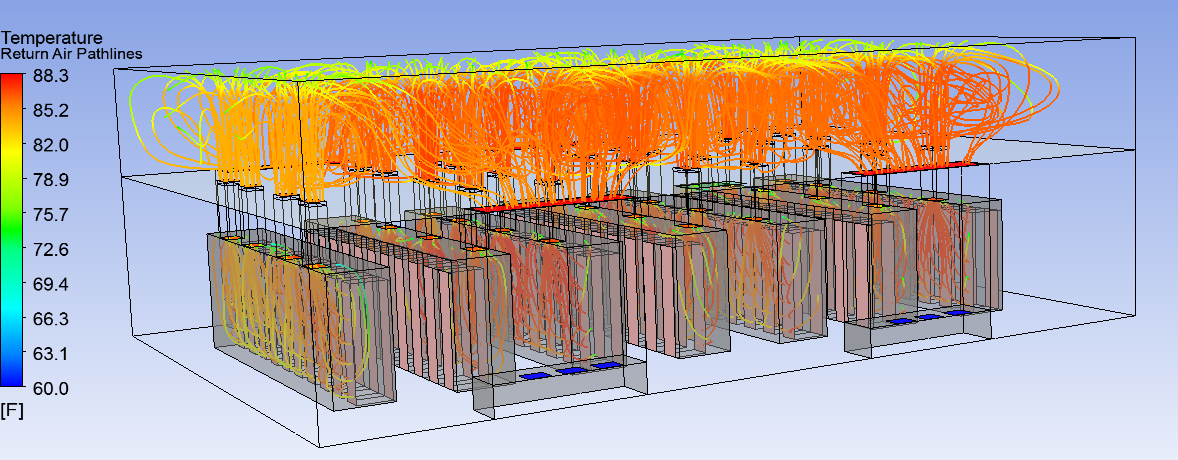
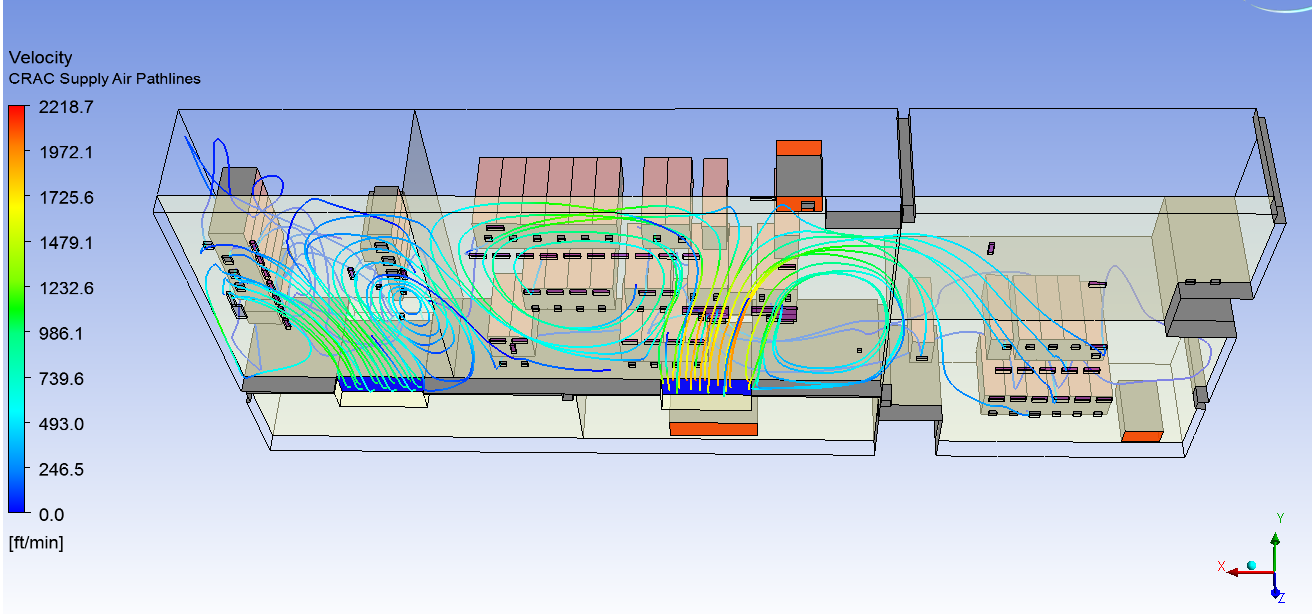
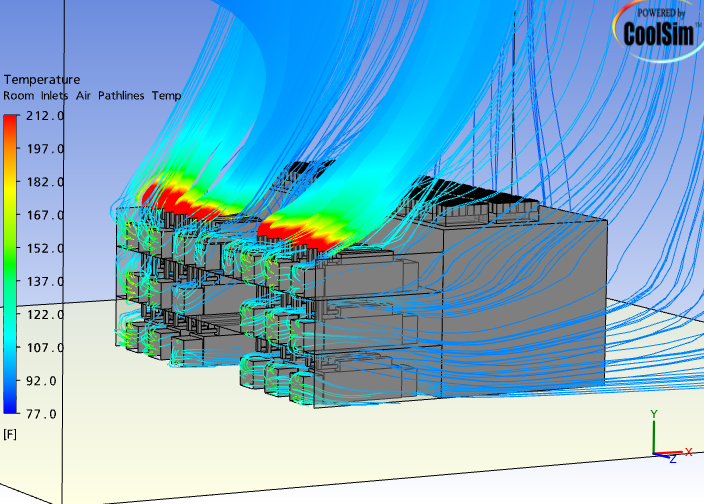
Visualize results with heat maps, pathline plots, and performance indicators to fine-tune your layout.

For Design / Build Engineers
Predict data center performance before implementation with CoolSim’s quick and easy CFD modeling. Assess IT load capacity, cooling unit failures, and compare design alternatives like hot/cold aisle containment and raised/non-raised floors. The automated CoolSim Output Report highlights key parameters for each scenario, helping designers present optimal solutions to customers based on reliability and cost.
Expert CFD Consulting Services
We provide personalized consulting to help you get the most out of your simulation investment—whether you're optimizing thermal performance or validating a new design.
🔧 Custom CFD Simulation Support
Get one-on-one assistance with model setup, meshing, boundary conditions, and solver configuration—ensuring simulations are both efficient and accurate.
🌀 Data Center Optimization
Analyze airflow patterns, thermal gradients, and equipment placement to uncover performance improvements and reduce cooling inefficiencies.
🧪 Design Review & Validation
We help interpret simulation results, validate design decisions, and ensure compliance with operational and environmental standards.